Check out the source code, here!

The Spark
Three years ago, during a summer in Chicago, I decided that, with all of the board games I’d been playing, it would be fun to track them and see trends, average scores, and time spent playing games. While it’s fun to nerd out about personal statistics, it could also be useful to see which games were actually getting played or if asymmetry between playable characters or factions was balanced.
I found an app called BGStats and have watched the app grow with my number of plays. It now encompasses board game expansions, deeper statistics, synchronization with Board Game Geek, and it’s own cloud backup, if you’re willing to pay a subscription.
This is not a paid sponsorship. I am not affiliated with BGStats or Apps by Eerko. Though I do recommend the app!
Since then, I have recorded a lot of games:
| Plays | Players | Games | Time | H-Index |
|---|---|---|---|---|
| 1380 | 180 | 154 | ~1014h | 19x19 |
The pandemic was a great time for board games, so it was fun to hit my 1000th play during the quarantine. Now, at another milestone of three years of recorded plays, I wanted to see if I could glean anything more using so much aggregated data.
Python Wrapper
BGStats enables users to export their data to a JSON file, though the file is fairly reminiscing of a database. The file is broken into a few “tables” (arrays in JSON) of Players, Games, Plays, and Locations.
Plays links together many of these values using IDs. For example, a Play might include a list of 3 Player IDs, an ID for the Game, and an ID for the Location. Each ID can then be looked up in the corresponding table, very similar to a Foreign Key!
As a result, I wanted to create a wrapper that could move data from BGStatsExport.json into a database. And tada, the bg_stats library was born! (See bg_stats/ for more details.)
Strong Typing in dataclasses
As a fervent believer in typing, I wanted the Python wrapper to reflect the types of their JSON companions. This would also make serialization and, more importantly, deserialization simpler by providing a 1:1 mapping to a Python class.
class BgStats:
    games: List[Game]
    locations: List[Location]
    players: List[Player]
    plays: List[Play]

    @staticmethod
    def from_file(filename: Path) -> "BgStats":
        with open(filename) as raw_data:
return from_dict(BgStats, json.load(raw_data))dacite’s from_dict() method made short work of the JSON to Python conversions, which made it easy to work with native Python objects. The next step was getting that object formatted into a database.
Ingesting Data to MySQL
First, I had to initialize the table so that each Game, Play, etc. could be inserted with the corresponding fields. I used a base class, SqlTableEntry to define a few key member variables and function that would convert each object into valid SQL:
class SqlTableEntry(Protocol):
    TABLE_NAME: str
    SQL_SCHEMA: str

    def into_schema(self) -> str:
        raise NotImplementedError
The corresponding classes would then define their “shape” in the database:
@dataclass
class Player(SqlTableEntry):
    bggUsername: Optional[str]
    id: int
    isAnonymous: bool
    modificationDate: str
    name: str
    uuid: str

    TABLE_NAME = "players"
    SQL_SCHEMA = textwrap.dedent(
        """
        bgg_username VARCHAR(64),
        id INT PRIMARY KEY,
        is_anonymous BOOL,
        modification_date DATETIME,
        name VARCHAR(128),
        uuid VARCHAR(64)
    """
    )
At this point, my objects knew how they looked in SQL, so it was straightforward to create a query that would insert each of my bg_stats.api objects into a table, locally:
def cook_insert_entry_query(entry: SqlTableEntry) -> str:
    return textwrap.dedent(
        f"""
            INSERT INTO {type(entry).TABLE_NAME}
            ({extract_fields(type(entry).SQL_SCHEMA)})
            VALUES {entry.into_schema()}
        """
    )
Now, by running the script, I could populate the database with my exported board game data!
In theory, this design could be adapted to ingest a variety of data by defining a programmatic way to implement into_schema() for each class as well as the corresponding SQL_SCHEMA property. This is left as an exercise to the reader or maybe I’ll get to it one day.
Grafana Dashboard
I had recently been using Grafana for work, so I decided to take the plunge and also do some query practice using it to visualize some stats!

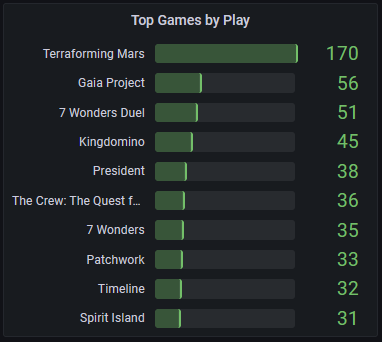
I’m still learning SQL, but some experimenting led to some fun visualizations. This dashboard shows a simple query to show the top 10 games sorted by play:
Below is the query used. We count the number of plays associated with each game and then sort by the number of plays.
SELECT
  games.name AS game_name,
  COUNT(plays.id) AS num_plays
FROM games LEFT OUTER JOIN plays
  ON games.id = plays.game_ref_id
GROUP BY games.id
ORDER BY num_plays DESC
By now, I felt I had gotten some decent practice piecing together a dashboard using a database. The deeper queries I was hoping to explore had been cast into the backlog of making a Python wrapper and Grafana dashboard that a month had passed with no results about the board games themselves. So what had I learned?
Learnings + Takeaways
For starters, I learned that there’s probably not much more information to draw from board games and their scores. It’s a fun mechanism to track plays in the same way that I like tracking runs or bike rides on a fitness watch. But I couldn’t think of many in-depth queries that would answer any burning questions.
For visualization, I tried plotting things using matplotlib, a powerful Python library for graphing, but I wanted practice with Grafana for professional reasons. I would still recommend exploring matplotlib for your usecase, though I did find it easier to tinker with Grafana’s queries through a UI that would update live, though perhaps there’s a way to do that with matplotlib?
From a technical perspective, I learned to appreciate the quicker, dirtier solution to accomplish a task. I think long-term longevity is extremely important, but don’t let perfect be the enemy of done. Some solutions could have been made more generic, but I didn’t need them to be yet.
While I didn’t learn more about my playing habits, I did learn more about SQL and Grafana. For reference, check out the source code, here.